

Building facts
- Address
- 5775 Collins Avenue
- Neighborhood
- Miami Beach
- Year built
- 2021
- Floors
- 18
- Residences
- 71
- Status
- Completed
- Developer
- Multiplan REAM
- Architect
- Arquitectonica
- Pricing
- Starting at $3.795 Million
Verified 21 August 2026Miami-Dade County Property Appraiser1 source
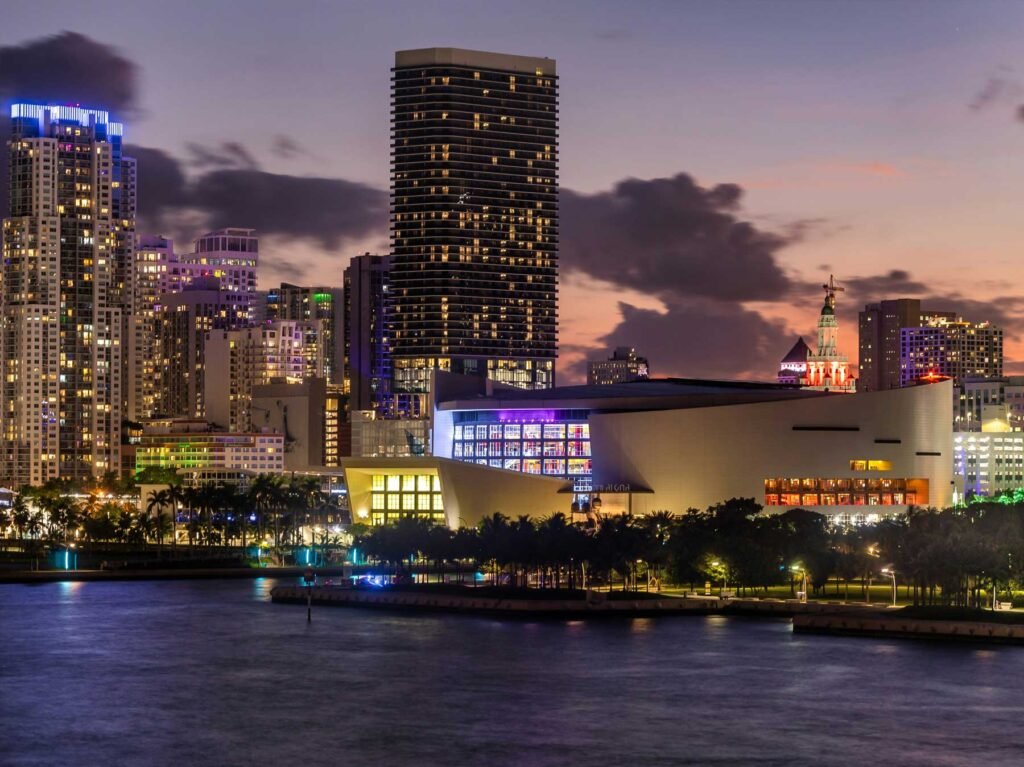
57 Ocean — photography to follow
Key Takeaways
- Sixty-six of the 69 homes closed inside a single 60-day window — between 19 October and 17 December 2021, at a median of $2,044 per square foot.
- Twenty-two of those buyers have since resold and every one of them gained — a median of +38.6% over a median holding period of 1.9 years.
- That is rare but not unique — and the holding period is the point — twenty buildings measured on this site show no losses on the record, but only two of them did it in under three years.
- The record sale is $37,000,000 — in June 2022, for the 7,456 square foot penthouse — $4,962 per square foot.
- Median price fell in 2025 and the market did not — the three homes that sold that year were simply smaller; per square foot the building held above $2,250.
- It trades rarely — 16 qualified sales across four years in 69 homes — about one home in seventeen each year.
57 Ocean, by the numbers
Developer: Multiplan REAM · Architect: Arquitectonica · Starting at $3.795 Million. Source: the building record on this site.
5775 Collins Avenue, Miami Beach, Florida 33140 | Neighborhood: Miami Beach
What is actually inside the building
The Miami-Dade County Property Appraiser holds 69 folios for 57 Ocean, and all 69 of them are residences. There is no commercial folio, no deeded parking series, no storage or cabana series — unusually clean for an oceanfront building of this class. The declaration’s common-element shares close at exactly 100.0000%, so this is the whole condominium and nothing is missing from what follows.
The homes run 1,176 to 7,456 square feet, with a median of 1,612. The bedroom mix is 39 two-bedrooms, 11 three-bedrooms, 17 four-bedrooms and two five-bedrooms — which is a wider spread than the headline suggests, and the reason a single median sale price for this building is close to meaningless.
Six floorplates cover three quarters of it: 1,612 square feet (14 homes), 1,176 (13), 3,346 (9), 1,276 (7), 1,972 (6) and 3,275 (6).
The 2026 assessed values run $1,756,920 to $31,814,640, with a median of $4,469,157. That maximum is the 7,456 square foot penthouse; the minimum is a 1,176 square foot two-bedroom. The building spans an eighteen-fold range in assessed value, and any figure quoted for it as a whole should be read with that in mind.
What happened to the people who bought at the sell-out
This building has an unusually legible history, because it effectively began on one day.
Sixty-six of the 69 homes recorded their first qualified sale between 19 October and 17 December 2021 — a 60-day window — at a median of $2,044 per square foot and a median price of $3,875,000. Everything since is measurable against that.
Twenty-two of those 66 buyers have since sold. All twenty-two gained. The median outcome is +38.6%, over a median holding period of 1.9 years, with a range from +7.1% to +82.2%. Both legs of every pair are qualified arm’s-length transactions above a nominal amount, so foreclosures, deeds in lieu and corrective transfers are excluded rather than filtered by price.
I want to be careful about how much weight that carries, because a zero-loss record is the sort of number that gets quoted without its caveats.
Twenty of the 184 buildings I have measured with twenty or more homes and ten or more completed round trips show no losses at all. So it is not unique. What is unusual here is the clock: almost all of those twenty compiled their record over a decade or more, where general price growth does much of the work. Only two of the twenty did it on a median holding period under three years, and 57 Ocean is one of them.
Four examples, at both ends:
- Unit 302, 1,612 square feet: $3,045,500 in October 2021, $5,550,000 in May 2023 — up 82.2% in 1.6 years.
- Penthouse 2, 6,079 square feet: $13,800,000 in October 2021, $25,000,000 in April 2024 — up 81.2% in 2.5 years.
- Unit 1505, 1,176 square feet: $1,850,000 in October 2021, $3,300,000 in April 2022 — up 78.4% in six months.
- Unit 1105, 1,176 square feet: $2,475,000 in October 2021, $2,650,000 in December 2025 — up 7.1% over 4.1 years.
That last one is the honest counterweight. It is still a gain, but over four years it is barely one, and it is the same 1,176 square foot floorplate as the home that gained 78.4% in six months. What separated them was the exit date, not the apartment. The county record shows transactions and not reasons, so it cannot tell you why any owner sold, or what condition a home was in at either end.
The price record
Qualified, arm’s-length sales from the county record, retrieved 21 August 2026.
| Year | Qualified sales | Median price | Median $/sq ft |
|---|---|---|---|
| 2023 | 6 | $6,325,000 | $3,161 |
| 2024 | 6 | $6,250,000 | $3,538 |
| 2025 | 3 | $3,150,000 | $2,679 |
| 2026 to date | 1 | $6,375,000 | $3,955 |
Read the middle column and 2025 looks like a collapse: $6,250,000 down to $3,150,000, a fall of roughly half. It is not. The median home that sold in 2024 was 1,792 square feet; in 2025 it was 1,176. Only three homes changed hands that year and two of them were the building’s smallest floorplate. Per square foot the same year reads $2,679 — softer than 2024, but nothing like halved.
This is why I lead with dollars per square foot on every building page, and it is rarely as stark as it is here.
I would not draw a trend line through this table. Sixteen qualified sales across four years, with 2026 resting on a single transaction, cannot establish a direction — and the +25.1% change from 2023 to 2026 that the per-foot column implies is one sale wide at the far end. My honest reading is that the building has traded in a band roughly between $2,250 and $4,000 per square foot since 2023, with the position inside that band driven mostly by which floorplate sold.
The record sale is $37,000,000, on 17 June 2022, for the 7,456 square foot penthouse — $4,962 per square foot, and the highest price the county holds for this building. That home is assessed at $31,814,640 for 2026.
Sixteen qualified sales in four years across 69 homes works out at about one home in seventeen each year. That is low turnover, and it is the practical constraint on buying here: in any given year there may be three or four homes available across the whole building, and they will not be the same floorplate.
Who this building suits
It suits a buyer who wants a specific apartment in a specific oceanfront building and is prepared to wait for it. With one home in seventeen trading each year and six floorplates covering three quarters of the building, the thing you want may not be for sale this year. If you need to move within a season, the constraint is supply, not price.
It suits a buyer who wants evidence rather than argument. The 2021 sell-out gives you a common baseline for almost every home in the building, and twenty-two completed round trips against it. Very few buildings let you see that clearly what ownership has actually produced.
It suits a short holding period badly, despite the record above. The zero-loss run was compiled through a rising window that started at a developer price; nothing in the county record says the next two years will resemble the last four, and the 2025 sales are the first sign of softening at the smaller end. Treat +38.6% in 1.9 years as what happened, not as what happens.
It suits a buyer who wants a small apartment in a cheap building least of all. The floor here is a 1,176 square foot two-bedroom assessed at $1,756,920. There is no entry point below that.
If you are selling here, your comparable set is thin and your evidence is unusually good. Three homes sold in 2025 and one so far in 2026, so a buyer’s agent will reach for the building median — and the building median is distorted by floorplate mix in both directions. Price against your own square footage and your own line, not against the headline. Ask me for the per-foot record on your floorplate before you set a number.
57 Ocean — Frequently Asked Questions
Have owners at 57 Ocean made money?
On the record so far, yes — without exception. Twenty-two of the 69 homes have a complete round trip in the county record, both legs qualified, and all twenty-two gained. The median outcome is +38.6% over a median holding period of 1.9 years, with a range from +7.1% to +82.2%.
Is a zero-loss record unusual?
Less than it sounds, and more than it sounds. Twenty of the 184 buildings measured on this site with twenty or more homes and ten or more completed round trips show no losses at all. But almost all of them compiled that record over a decade or more. Only two did it on a median holding period under three years, and 57 Ocean is one of them.
When did 57 Ocean sell out?
Sixty-six of the 69 homes recorded their first qualified sale between 19 October and 17 December 2021 — a 60-day window — at a median of $2,044 per square foot and a median price of $3,875,000.
Did prices fall at 57 Ocean in 2025?
The median sale price did, from $6,250,000 to $3,150,000, and that figure is misleading. Only three homes sold in 2025 and two of them were the building’s smallest floorplate at 1,176 square feet, against a median of 1,792 square feet in 2024. Measured per square foot the same year reads $2,679 — softer than 2024, not halved.
What is the most expensive sale at 57 Ocean?
$37,000,000 on 17 June 2022, for the 7,456 square foot penthouse — $4,962 per square foot. That home is assessed at $31,814,640 for 2026. The second-highest is $25,000,000 in April 2024 for the 6,079 square foot penthouse, bought for $13,800,000 at the 2021 sell-out.
How often do homes at 57 Ocean sell?
Rarely. Sixteen qualified sales across 2023, 2024, 2025 and 2026 to date, in 69 homes — about one home in seventeen each year. In practice that means three or four homes available in a typical year, across a building with six main floorplates.
How big are the homes at 57 Ocean?
From 1,176 to 7,456 square feet, with a median of 1,612. The mix is 39 two-bedrooms, 11 three-bedrooms, 17 four-bedrooms and two five-bedrooms. The 2026 assessed values run $1,756,920 to $31,814,640, median $4,469,157.
Sources and further reading
Interested in buying at 57 Ocean?
Learn more about buying a Miami Luxury Condo at 57 Ocean with Josh Stein.
Interested in selling at 57 Ocean?
Learn more about selling your condo at 57 Ocean with Josh Stein.
Thinking about 57 Ocean?
I have sold South Florida property since 2002, more than $1 billion of it. Ask me for the recorded declaration, what has genuinely closed, or a straight answer on whether this building fits what you are after.
Josh Stein · Florida real estate sales associate, license SL3057661 · (305) 695-8257 · hello@joshsteinrealtor.comRelated coverage
Part of Miami Luxury Condos.