

Building facts
- Address
- 460 NE 28 Street
- Neighborhood
- Edgewater
- Year built
- 2015
- Floors
- 44
- Residences
- 300
- Status
- Completed
- Developer
- Related Group
- Architect
- Arquitectonica
- Pricing
- Starting at $690,000
Verified against public recordsMiami-Dade County Property Appraiser1 source
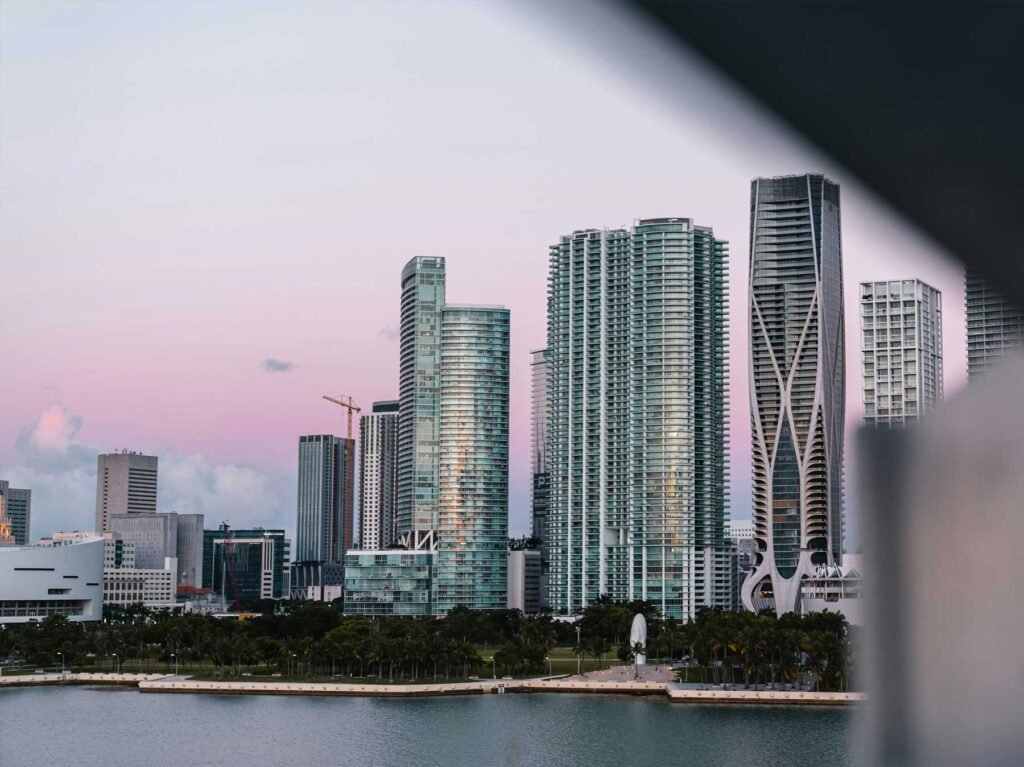
Icon Bay — photography to follow
Key Takeaways
- 299 residential homes — sit in Icon Bay’s single Miami-Dade County declaration at 460 NE 28 St; one further folio is a ground-floor commercial store, excluded from every figure below.
- Median $/sq ft has fallen 11.1% — since 2023, from $725 to $644 — and unlike some buildings in this data, price and $/sq ft agree here; both are down.
- The highest recorded price and the highest recorded $/sq ft belong to two different homes — $3,400,000 (unit 4304, $1,323/sf) is the record price; $3,025,000 (unit 4303, $1,344/sf) is the higher rate per foot, on a smaller unit.
- One home sold twice, a year apart, for two very different prices — unit 4104 closed at $2,450,000 on 3/13/2025 and again at $2,000,000 on 3/13/2026 — an 18.4% drop on the identical 2,569 sq ft.
- One home in 15 — changes hands here each year, based on the last four years of qualified sales.
- 2026 to date shows 12 qualified sales — through August — an incomplete year I would not treat as final.
Icon Bay, by the numbers
Developer: Related Group · Architect: Arquitectonica · Starting at $690,000. Source: the building record on this site.
460 NE 28th Street, Miami, FL 33137 | Neighborhood: Edgewater
What’s Actually Inside Icon Bay
Icon Bay is one Miami-Dade County condominium declaration — ICON BAY CONDO — at 460 NE 28 Street in Edgewater. The county’s roll carries 300 folios; 299 are residential homes and one is a ground-floor commercial store, which I’ve excluded from every number that follows.
Homes run from 854 to 2,569 square feet, median 1,107. The bed mix is concentrated in 2-bedroom layouts: 213 of the 299 homes, 71.2%, are 2-bedroom, with 34 (11.4%) 1-bedroom, 36 (12.0%) 3-bedroom, 12 (4.0%) 5-bedroom, and a small run of 4 (1.3%) 4-bedroom units. On the 2026 tax roll, assessed values across the 299 homes run from $364,463 to $2,159,064, median $588,762.
I don’t have a confirmed year built, story count, architect or amenity list — none of that is in the county’s property record, and I’d rather say so than fill it from memory or a listing site.
Is Icon Bay’s Market Actually Cooling?
| Year | Qualified sales | Median price | Median $/sq ft |
|---|---|---|---|
| 2023 | 33 | $800,000 | $725 |
| 2024 | 16 | $815,000 | $735 |
| 2025 | 17 | $720,000 | $645 |
| 2026 to date | 12 | $715,000 | $644 |
78 qualified sales closed across the building over those four years, against 299 homes — a turnover of one home in 15 each year, a healthier sample than most buildings I’ve worked from. 2026 is an incomplete year: the 12 sales above run only through late August.
I lead with $/sq ft, not price, because the two usually disagree when floorplates vary — but at Icon Bay they don’t, and that agreement is itself worth noting. Median price fell from $800,000 to $715,000, down 10.6%. Median $/sq ft fell from $725 to $644, down 11.1%. Both lines tell the same story: this building has softened, consistently, for four straight years, with 2024’s small uptick ($735/sf) the only year that broke the pattern. With 12 to 33 sales in every year of the window, and 78 across the whole four years, I’m comfortable calling this a real direction, not a thin-sample artifact — though the 11.1% figure is the four-year total, and the year-over-year pace has clearly slowed since the 2025 drop.
One nuance worth flagging: the building’s single highest recorded sale and its single highest recorded rate per square foot belong to two different homes. The record price is $3,400,000 (10/16/2020, unit 4304, 2,569 sq ft) — $1,323/sf. The higher rate per foot, $1,344/sf, belongs to a smaller sale: $3,025,000 for unit 4303 (6/11/2024, 2,250 sq ft). The building’s own $/sq ft band across 2023–26 runs $443 to $1,344, median $720.
One Home, Two Sales, A Year Apart
The cleanest evidence I have for the direction above doesn’t come from a median across dozens of different homes — it comes from one unit selling twice. Unit 4104, 2,569 square feet, closed at $2,450,000 on 3/13/2025 ($954/sf). The identical unit closed again exactly one year later, 3/13/2026, for $2,000,000 ($779/sf) — an 18.4% decline on the same floorplate, same walls, same view, twelve months apart. Both sales are recorded as qualified, arm’s-length transactions in the county record.
That single repeat sale doesn’t prove a building-wide rate of decline — it’s one home — but it’s a data point that can’t be explained away by a change in unit mix or floorplate size the way a median price sometimes can, and it lines up with the four-year $/sq ft trend above rather than contradicting it. The same unit also sold once further back, for $2,250,000 in October 2015 ($876/sf), so I have three data points on this exact floorplate spanning eleven years: $876/sf, then $954/sf, then $779/sf most recently.
It’s worth being precise about what this does and doesn’t say about the building’s longer history. Looking at every home that has completed a documented round trip — bought and later sold, both legs a qualified, arm’s-length transaction — 191 of the 299 homes have one. 134 gained value, 57 lost, with a median gain of 15.3% over a median 6.6-year hold, and a range from -30.0% to +91.7%. That record mostly reflects sales made in the 2015-2020 era reselling later; it predates the four-year softening documented above and shouldn’t be read as evidence against it. The two windows are simply measuring different periods — a buyer looking at Icon Bay today is buying into the recent trend, not the decade-long one.
Who Icon Bay Fits Best
This is a building with real liquidity by the standards of this dataset — one home in 15 a year, 78 qualified sales across four years — which makes it a reasonable choice for a buyer who wants a resale market with real depth to lean on, and for an investor comparing against a genuine, recent comp set rather than a handful of stale sales. The size range (854 to 2,569 sq ft) and the dominant 2-bedroom mix (71.2% of homes) point at a primary-residence or rental-hold buyer more than a trophy-unit buyer.
What this building does not currently offer is price momentum. Four straight years of falling or flat $/sq ft, confirmed by the same-unit repeat sale above, means a buyer here should not count on near-term appreciation as part of the thesis — the liquidity is real, the recent price direction is down.
To a seller: with 12 to 33 comparable sales closing every year, you have more genuine price discovery here than in a thin-turnover building — use it. I’d price against the building’s current $443–$1,344/sf band and the most recent quarters specifically, not against 2023 or 2024 comps, given the consistent softening documented above.
Icon Bay — Frequently Asked Questions
How many homes are in Icon Bay?
The Miami-Dade County Property Appraiser’s roll carries 299 residential folios; one further folio is a ground-floor commercial store, not a home.
What is the median price per square foot at Icon Bay?
Across 78 qualified sales from 2023 through 2026 to date, the median is $720/sf, with a building band running from $443 to $1,344 over that period.
What is the highest price ever paid at Icon Bay?
$3,400,000, closed 10/16/2020, for a 2,569 sq ft home, unit 4304 — $1,323/sf. A different, smaller unit holds the building’s highest rate per square foot, $1,344/sf.
Is Icon Bay’s market rising or falling?
Falling. Median $/sq ft has dropped 11.1% since 2023, and both median price and median $/sq ft move together in the same direction across all four years except a small 2024 uptick.
How often do homes sell at Icon Bay?
About one home in 15 changes hands each year based on the last four years of qualified sales — a comparatively liquid building for this dataset.
What size homes does Icon Bay have?
From 854 to 2,569 square feet, median 1,107, with over 70% of homes carrying a 2-bedroom layout.
Is there concrete evidence the market has actually softened, not just the medians?
Yes — unit 4104 sold for $2,450,000 in March 2025 and again for $2,000,000 in March 2026, exactly a year later, an 18.4% decline on the identical floorplate.
Sources and further reading
Interested in selling at Icon Bay?
Learn more about selling your condo at Icon Bay with Josh Stein.
Edgewater Condo & Loft Buildings
Edgewater runs along Biscayne Bay between the Venetian Causeway and the Julia Tuttle. Every building below is covered in this series, with its own county sales record:
- 1800 Biscayne Plaza
- 1800 Club
- Aria on the Bay
- Bay House
- Biscayne Beach
- Blue Condominium
- Cite on the Bay
- City 24
- Edgewater Lofts
- Elysee Miami
- Gallery Art Condominium
- Gran Paraiso
- Moon Bay
- New Wave
- One Paraiso
- Onyx on the Bay
- Opera Tower
- Paraiso Bay
- Paramount Bay
- Platinum Condo
- Quantum on the Bay
- The Crimson
- The Grand Condos Miami
- Uptown Lofts
Thinking about Icon Bay?
I have sold South Florida property since 2002, more than $1 billion of it. Ask me for the recorded declaration, what has genuinely closed, or a straight answer on whether this building fits what you are after.
Josh Stein · Florida real estate sales associate, license SL3057661 · (305) 695-8257 · hello@joshsteinrealtor.comRelated coverage
Part of Miami Luxury Condos.